The percentage of Australian respondents reporting domestic and foreign late payments in 2017 (88.1%) has increased compared to last year (84.0%).
In 2017, Australia’s GDP growth is not expected to exceed the 2016 rate of 2.5%. A slightly more optimistic outlook is foreseen for 2018, when growth is expected to accelerate to 2.8%. Despite the country’s stable performance, there were fewer sales on credit terms compared to one year ago.
Sales on credit terms
The average total value of sales made on credit terms in Australia decreased from 49.1% in 2016 to 43.8% this year. This was mainly due to the sharp decrease in the average percentage of foreign B2B sales on credit. Among the Asia Pacific countries surveyed, Australia has the second lowest average percentage of transactions on credit after that of China (40.7%).
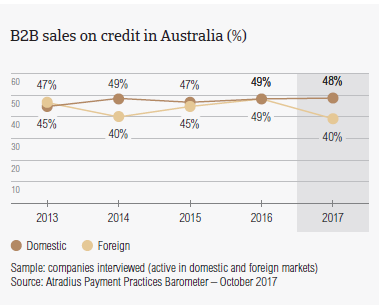
- The average percentage of domestic B2B sales on credit made by respondents in Australia decreased from 49.3% in 2016 to 47.7% this year.
- A more significant decline was observed in respect to Australian suppliers’ foreign B2B sales. The percentage of B2B sales on credit to foreign B2B customers declined from 48.8% in 2016 to 39.9% this year.
- The greater reluctance to offer credit to foreign B2B buyers and the higher level of trust when dealing with compatriots was observed in Australia and in the Asia Pacific region overall.
- Compared to the regional averages (domestic: 49.5%; foreign: 42.2%), respondents in Australia are less likely to sell on credit terms to both their domestic and foreign B2B customers.
Overdue B2B invoices (%)
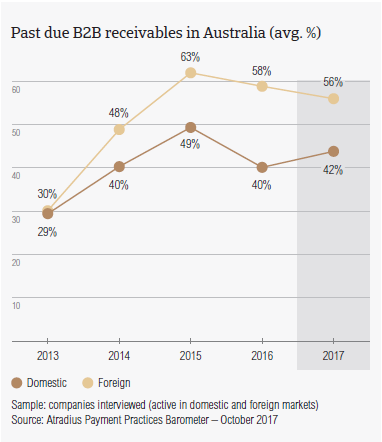
In 2017, respondents in Australia reported late payments from their domestic and foreign B2B customers more frequently than one year ago. However, the percentage of overdue B2B invoices remained stable.
- Compared to their peers in Asia Pacific (89.2%), slightly fewer respondents in Australia (88.1%) reported late payments from their B2B customers in 2017. However, the percentage of Australian respondents reporting domestic and foreign late payments in 2017 has increased compared to 2016 when it stood at 84.0%.
- On average, 42.4% of domestic invoices and 56.2% of foreign invoices in Australia remained unpaid at the due date. The country’s proportion of domestic and foreign past due B2B invoices is higher than the regional averages (domestic: 44.6%; foreign: 46.1%) and has seen small changes compared to the same period last year (domestic: 40.3%; foreign: 57.6%).
- The average Days Sales Outstanding (DSO) figure in Australia decreased from 25 days in 2016 to 22 days this year. Among the Asia Pacific countries surveyed, this is by far the lowest DSO figure, and well below the regional average of 40 days.
- Looking ahead, most respondents in Australia (56.7%) do not expect a change in their average DSO over the next 12 months. However, 28.9% expect a slight increase over the same time frame while 7.0% are more optimistic and expect a slight decrease in their average DSO.
Payment duration (average days)
Payment duration in Australia improved from an average of 50 days in 2016 to 46 days in 2017. This is also the shortest credit to cash turnaround in the Asia Pacific region this year.
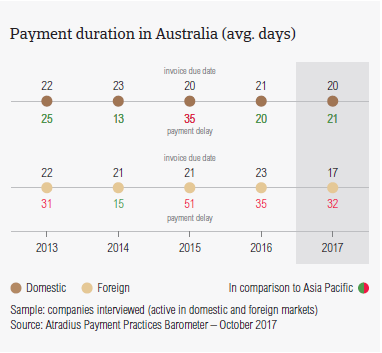
- In 2017, suppliers in Australia asked their domestic and foreign B2B customers to settle their invoices faster. More specifically, domestic B2B customers had, on average, 20 days and foreign B2B customers had, on average, 17 days to fulfil their payment obligations.
- The average payment terms in 2016 stood at 21 days for domestic B2B customers and 23 days for foreign B2B customers.
- The average payment terms recorded in Australia are much shorter than the regional averages (domestic: 29 days; foreign: 30 days).
- Respondents in Australia reported small changes in respect to payment delays by their domestic and foreign B2B customers. According to survey findings, there was a minor increase in the average payment delays of domestic B2B customers (from 20 days in 2016 to 21 days in 2017). In contrast, foreign B2B customers delayed payments, on average, by 32 days (2016: 35 days).
- When compared to the regional average of 55 days, in 2017, Australia (with an average of 46 days) had a quicker credit to cash turnaround.
Key payment delay factors
The most frequently reported reason for payment delays in Australia was buyers using outstanding invoices as a form of financing. This is different than in Asia Pacific overall, where the key payment delay factor reported is insufficient availability of funds.
- 34.3% of respondents in Australia cited buyers using outstanding invoices as a form of financing as the main reason for domestic payment delays. The second most frequently cited reason for domestic payment delays was insufficient availability of funds (32.9% of respondents). At regional level, suppliers noted buyers using outstanding invoices as a form of financing less frequently (25.3% of respondents stated this) and insufficient availability of funds most frequently(43.8%, a much higher percentage than in Australia).
- The top two reasons for foreign payment delays in Australia are buyers using outstanding invoices as a form of financing (27.5% of respondents stated this) and insufficient availability of funds (26.4%). While insufficient availability of funds was also the most reported reason at regional level (33.3% of respondents), buyers using outstanding invoices as a form of financing was only the fifth most reported reason (23.2%).
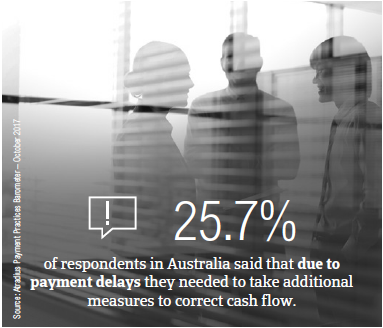
- When asked about the impact of overdue invoices on their businesses, 35.4% of respondents in Australia said that there was no significant impact. However, 25.7% of respondents said that they needed to postpone their own payments to suppliers and 22.9% that they needed to take specific actions to correct cash flow.
Protection of business profitability
Next to their peers in Japan, respondents in Australia are some of the least likely in the Asia Pacific region to increase their use of credit management practices to protect themselves against risks stemming from Brexit, US protectionism and the slowdown in Asia.
- 23.6% of respondents in Australia (30.3% at regional level) plan to increase their use of credit management tools in the face of the above-mentioned developments. This is far below the percentage of respondents who stated that they will make no changes in their current mix of credit management practices (44.4%).
- Should Australian suppliers adjust their credit management practices, the preferred tools are the same as those stated in Asia Pacific overall: checks on buyers’ creditworthiness (stated by 27.9% of respondents) and monitoring of buyers’ credit risk (25.7%). The percentages for Asia Pacific are much higher: increasing checks on buyers’ creditworthiness (36.1%) and increasing monitoring of buyers’ credit risk (34.0%).
- With China as a main trading partner, respondents in Australia seem to be most concerned about risks stemming from the slowdown in Asia. 33.8% of respondents stated that they will increase creditworthiness checks on their buyers and 29.6% that they will increase monitoring of their buyers’ credit risk.
- Brexit and US protectionism seem to spur fewer Australian suppliers to increase protection: Brexit (increase creditworthiness checks: 20.6%; increase monitoring of buyers’ credit risk: 24.1%); US protectionism (increase creditworthiness checks: 29.4%; increase monitoring of buyers’ credit risk: 23.5%)
Uncollectable receivables
The total value of B2B receivables written off as uncollectable in Australia (1.6%) is far under the regional average of 2.1%.
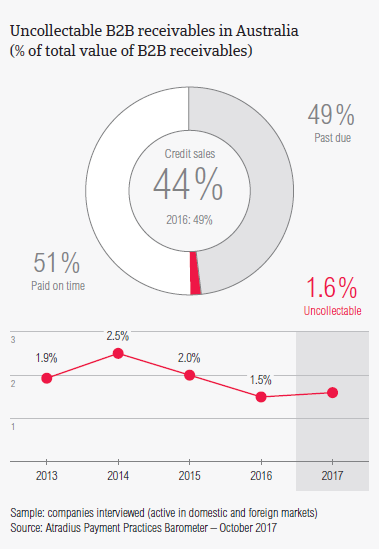
- Similarly to what was observed in previous surveys, in 2017, domestic receivables were written off as uncollectable more often than foreign ones (domestic: 1.2%; foreign: 0.4%). Compared to the year before, there were no major changes (domestic: 1.2%; foreign: 0.3%)
- The total value of uncollectable receivables in Australia is lower than the average for Asia Pacific overall (domestic: 1.5% and foreign 0.6%).
- Uncollectable receivables in Australia originated most often from B2B customers in these sectors: construction, electronics, business services and consumer durables.
- Respondents in Australia reported that the main reasons why B2B receivables were uncollectable were: the customer going bankrupt or out of business (reported by 37.5%), the inability to locate the customer (32.7%) and the old age of the debt (37.9%).
Payment practices by industry
Looking ahead, more respondents in Australia seem to expect a slight deterioration than an improvement in the payment behaviour of their B2B customers over the coming 12 months.

- Invoice payment terms extended to B2B customers in the paper industry (averaging 43 days from the invoice date) appear to be far above the country average (19 days). B2B customers in construction materials and those in the transport sector also enjoyed longer payment terms (on average, 30 days for each of these sector).
- In contrast, B2B customers in the textiles and agriculture sectors were asked to pay their invoices the fastest (on average, nine and 10 days respectively).
- Customers in the chemicals sector and those in financial services generated some of the longest payment delays. B2B customers in these sectors, paid on average 38 and 35 days late respectively.
- The top two reasons for payment delays in the chemicals sector seem to be buyers using outstanding invoices as a form of financing and the complexity of the payment procedure (each reason stated by 44% of respondents).
- Looking at payment delays in financial services, Australian suppliers reported that their B2B domestic and foreign customers in this sector delay payments most often because of disputes over the quality of goods and services provided and because buyers are using outstanding invoices as a form of financing (each reason stated by 38% of respondents).

